
Can Site Enrollment Data Improve Clinical Trial Forecasts?
By Uchemadu Nwachukwu

Clinical trial supply planning must balance two asymmetric risks: insufficient inventory can interrupt treatment and compromise trial continuity, while excess inventory can expire or require destruction if recruitment slows or the study fails. Site-level enrollment data are potentially valuable because they reveal the realized trajectory of patient demand before aggregate study milestones become informative. Recent work supports using enrollment data in Bayesian updating, Poisson–Gamma models, machine learning site ranking, and simulation-optimization, although the evidence is stronger for enrollment and demand prediction than for direct reductions in supply cost or waste.1,2,3,4 This article evaluates the technical case for enrollment-informed supply forecasting. It describes statistical and machine learning models, shows how enrollment predictions can be translated into inventory decisions, and identifies the validation metrics needed before deployment.
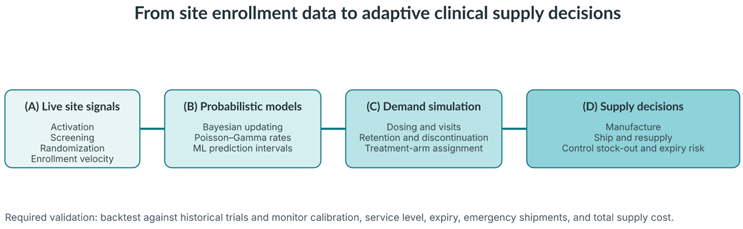
Figure 1. Graphical abstract showing four linked stages: (A) live site signals, (B) probabilistic enrollment models, (C) demand simulation, and (D) adaptive supply decisions. Site enrollment data update demand forecasts, while dosing, retention, inventory, and logistics data remain necessary for a complete supply forecast.
Why Enrollment Is A Supply Signal
For a site i and time interval t, let Eᵢ,ₜ denote newly randomized participants. A simple supply forecast might treat demand as proportional to expected enrollment:
Dₜ = ∑ᵢ Eᵢ,ₜ × qᵢ
where qᵢ is the expected quantity of investigational product required per participant. This is useful but incomplete. The relevant demand is usually the number of treatment kits, units, or doses required at each future visit, not merely the number of patients randomized during the interval.
A more realistic demand equation is:
Dₜ₊ₕ = ∑ᵢ ∑ₐ∈A Nᵢ,ₜ₊ₕ,ₐ × uₐ × pᵢ,ₐ × rᵢ,ₜ₊ₕ
where Nᵢ,ₜ₊ₕ,ₐ is the number of patients expected to require treatment arm or dose a at future time t + h, uₐ is the unit requirement per dispensing event, pᵢ,ₐ is the probability of assignment to treatment arm or dose a, and rᵢ,ₜ₊ₕ represents retention and visit attendance. Here, A denotes the set of treatment arms or dose levels included in the trial, and a ∈A denotes an individual treatment arm or dose within that set. The model should also account for screening failures, replacements, protocol amendments, missed visits, treatment discontinuation, and wastage.
The 2022 work of Anisimov and Austin is directly relevant to this idea. Their enrollment framework models country- and region-level recruitment, enrollment caps, and the use of historical trials, then uses the results to allocate sites and countries while constraining the probability of reaching the enrollment target on time.1 This is not a complete supply model, but it provides the demand-side structure needed by one.
This equation captures the practical value of early site data. Before a site has recruited, its estimate is shrunk toward the prior or historical rate. After enrollment accumulates, the estimate shifts toward the site's observed performance. That updated rate can feed a forward simulation of patients, visits, kit demand, and inventory position.
Anisimov's 2023 methodology applies interim, data-driven Bayesian adjustment to site enrollment rates and estimates future performance at center, country, and regional levels. It also calculates the probability that a site or region will recruit no patients, or no more than a specified number, in a future interval.2 Those are particularly useful outputs for supply planning because a resupply decision is often a threshold decision: ship, defer, reduce, or escalate.
Zhong and colleagues used generalized linear mixed-effects models and non-homogeneous Poisson processes to model country initiation, site activation, and subject enrollment sequentially. Their 2023 framework was evaluated on 25 studies across four therapeutic areas and reported improved prediction accuracy relative to a traditional statistical approach, with calibrated prediction intervals and enrollment curves with confidence bands.5 For supply planning, calibrated intervals are more important than an apparently accurate average: a forecast that understates the upper tail can create stockouts even if its mean prediction is reasonable.
From Enrollment Prediction To Inventory Decisions
An enrollment forecast becomes a supply forecast only after it is translated through the trial's treatment and logistics rules. Let Iᵢ,ₜ be inventory at site i, Sᵢ,ₜ shipments received, Cᵢ,ₜ consumption, and Wᵢ,ₜ wastage. Inventory evolves as:
Iᵢ,ₜ₊₁ = Iᵢ,ₜ + Sᵢ,ₜ − Cᵢ,ₜ − Wᵢ,ₜ
Consumption can be simulated from patient-level or cohort-level demand. For each future patient, the simulation samples treatment assignment, dosing schedule, visit attendance, discontinuation, and replacement. The model then aggregates kit demand by site and time period.
A shipment policy can be defined using a reorder point:
Sᵢ,ₜ = max(0, Qᵢ,ₜ(p) + SSᵢ − Iᵢ,ₜ,available)
where Qᵢ,ₜ(p) is the forecast demand through the next shipment cycle at percentile p, SSᵢ is safety stock, and Iᵢ,ₜ,available includes usable on-hand and confirmed in-transit inventory. The percentile should reflect the cost of a stockout relative to the cost of expiry and destruction. For example, consider a site with eight kits currently available and four kits confirmed in transit. Its previous enrollment forecast was two patients per month, but recent enrollment data indicate a posterior mean of three and a half patients per month. If the resupply lead time is six weeks and the 90th percentile demand over that period is seven kits, the supply system should compare this requirement with usable inventory rather than relying on the previous forecast. If projected demand plus safety stock exceeds available inventory, the system triggers a shipment. If subsequent enrollment data show that recruitment has slowed, the next forecast update can reduce or defer the following shipment, limiting excess inventory and expiry risk. This illustrates the operational role of enrollment data: the value of the forecast is not simply a more accurate estimate of future patients but a timely change in the quantity and timing of supply decisions.
This is a cost trade-off. A stylized objective function is:
min cₘM + cₛ∑ᵢ,ₜSᵢ,ₜ + cₑ∑ᵢ,ₜWᵢ,ₜ + cₒ∑ᵢ,ₜOᵢ,ₜ + cᵦ∑ᵢ,ₜBᵢ,ₜ
where M is manufactured quantity, Oᵢ,ₜ is excess inventory, Bᵢ,ₜ is backorder or stockout exposure, and the coefficients represent manufacturing, shipping, expiry, holding, and shortage costs. The constraints include production batch sizes, release capacity, shelf life, minimum shipment quantities, country restrictions, and depot lead times.
Pang, Yan, and Hua addressed this class of problem in a 2023 study of adaptive clinical trials. They describe uncertainty in maximum supply requirements, shifting supply needs, and rapid availability requirements at adaptation points; their approach uses simulation, real-time trial data, and particle-swarm optimization for supply planning.3 This is especially relevant when enrollment interacts with adaptive randomization or sample size changes.

A Proposed End-to-End Forecasting Workflow
A robust implementation can be organized into five layers.
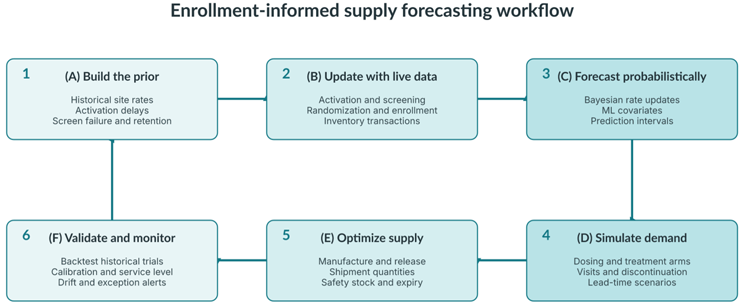
Figure 2. Workflow with six labeled panels: (A) build the prior, (B) update with live data, (C) forecast probabilistically, (D) simulate demand, (E) optimize supply, and (F) validate and monitor. The final validation step feeds back into model recalibration.
First, establish a prior. Use historical studies to estimate activation delays, recruitment rates, screen failure, retention, treatment duration, and regional variation. The 2022 literature supports using historical enrollment and country-level aggregation rather than relying only on a global average.1 Site recruitment prediction has also been proposed as an element of risk-based trial management, particularly during feasibility and site selection.7
Second, update with live data. Ingest site activation, screening, randomization, enrollment velocity, missed visits, discontinuations, and inventory transactions at a defined cadence. Apply Bayesian updating or a time-series model so that each new observation changes the forecast without overreacting to random short-term variation.
Third, generate scenarios. Simulate thousands of future paths rather than producing only a point estimate. Scenarios should vary enrollment rate, screen failure, randomization, retention, treatment duration, visit timing, and supply lead time. The output should include median demand, prediction intervals, probability of stockout, expected expiry, and expected excess inventory.
Fourth, optimize actions. Convert scenarios into recommended shipment quantities, production timing, site activation priorities, and escalation rules. A site with high forecast demand but long logistics lead time may require earlier action than a faster-recruiting site located near a depot.
Fifth, back-test and monitor. Compare the model with the original supply plan and with simpler benchmarks. Useful metrics include mean absolute error for enrollment, weighted interval score for probabilistic forecasts, stockout frequency, expiry units, emergency shipments, service level, and total supply cost. The model should also be checked for drift after protocol amendments, country expansion, or major changes in recruitment strategy.
Limitations And Implementation Risks
Enrollment data can be misleading. A site's early recruitment spike may reflect a small number of prescreened patients rather than a stable rate. Missing or delayed data can make a weak site appear inactive. Aggregate country-level data can hide a single high-performing site's demand. Real-world data may improve site selection but can be biased by healthcare access, referral patterns, coding quality, and differences between the real-world population and trial eligibility criteria.
The recent evidence base also has a clear boundary. The studies reviewed here demonstrate improvements in enrollment forecasting, site ranking, uncertainty estimation, or supply optimization.5,3,4,6 They do not establish a universal percentage reduction in clinical supply cost or expiry. That outcome must be tested in sponsor-specific historical back-tests and controlled prospective deployment.
Conclusion
Site enrollment data can improve clinical trial supply forecasts because they reveal the realized demand trajectory earlier than aggregate study milestones. Bayesian Poisson–Gamma models provide an interpretable way to update site rates; non-homogeneous processes represent changing enrollment intensity; machine learning captures nonlinear relationships among site, patient, study, and operational features; and simulation-optimization translates uncertain enrollment into manufacturing and resupply decisions.
The correct design is not “enrollment data instead of the supply model.” It is an integrated probabilistic system in which enrollment is one high-value signal among several. The decisive evaluation is operational: does the enrollment-informed model maintain the required service level while reducing expiry, emergency shipments, and total inventory cost relative to the existing planning process? Recent research makes that test technically feasible, but it does not remove the need to run it.
References:
- Anisimov V, Austin M. Modeling restricted enrollment and optimal cost-efficient design in multicenter clinical trials [Internet]. 2022 [cited Sept. 18, 2026]. https://www.semanticscholar.org/paper/2fa8ba95d345303f1a76f7900f1650cd66bb8d89
- Anisimov V. An analytic methodology for forecasting patient enrolment performance in multicentre clinical trials. In: Proceedings of the 2023 ACM Conference; 2023 [cited Sept. 18, 2026]. https://dl.acm.org/doi/pdf/10.1145/3613347.3613361
- Pang J, Yan H, Hua Z. Drug supply chain optimization for adaptive clinical trials [Internet]. 2023 [cited Sept. 18, 2026]. https://www.semanticscholar.org/paper/749263476e7b9f82e1eb9eb2e9f44d8c3596e5d8
- Hulstaert L, Twick I, Sarsour K, Verstraete H. Enhancing site selection strategies in clinical trial recruitment using real-world data modeling. PLoS One. 2024;19(3). doi:10.1371/journal.pone.0300109.
- Zhong S, Xing Y, Yu M, Wang L. Enrollment forecast for clinical trials at the portfolio planning phase based on site-level historical data [Internet]. 2023 [cited Sept. 18, 2026]. https://arxiv.org/pdf/2301.01351
- Do T, Masquelier A, Lee NE, Crowther J. Deep learning-based prediction of clinical trial enrollment with uncertainty estimates [Internet]. 2025 [cited Sept. 18, 2026].
- Milovanov S. Predicting of enrollment as a part of risk-based management of clinical trials [Internet]. 2022 [cited Sept. 18, 2026]. https://ijcimr.org/articles/IJCIMR-V3-1113.pdf
About The Author:
 Uchemadu Nwachukwu is a public health data analyst, health informatics professional, and clinical data management professional with over eight years of experience across healthcare analytics, clinical research, health informatics, and real-world evidence. He holds a First-Class MSc in applied clinical data analytics from the University of Galway and has expertise in statistical modeling, machine learning, epidemiological analysis, healthcare data management, interoperability, and clinical information systems. His work focuses on applying data, technology, and analytical methods to support clinical research, healthcare improvement, and evidence-based decision-making. His professional interests include digital health, health informatics, clinical research, healthcare analytics, epidemiology, and data-driven approaches to improving healthcare systems and outcomes.