
The Fifth Model: Where It Works, Where It Doesn't, And The Economics Behind It
By John O’Brien

Part 3 of a four-part series: “Beyond Bulk — Rethinking Comparator Supply for Modern Clinical Trials”
In the previous article, I introduced the U.S. pharmacy card “pull” model — what it is, how it is stood up, and how product reaches the patient. This article turns to the harder questions: where the model genuinely fits, where it breaks down, and what it actually costs relative to the centralized “push” approaches sponsors default to today.
One clarification on terms first. Throughout this article and my last, “comparator” is used in its practical, broad sense: it covers not only a drug studied head-to-head against the sponsor’s investigational product but also standard-of-care agents and the supportive or concomitant prescription medicines a protocol requires. The pull model applies to any of these, so long as the product is commercially available in the U.S.; the same mechanism would extend to other open-label commercial supply, a use case worth its own treatment another time.
Where The Model Fits — And Where It Doesn’t
This is a fifth option, not a replacement for the other four.¹ It fits a specific, and increasingly common, profile:
- Open-label trials in the United States (extending in practice to Canada and Puerto Rico)
- Commercially available comparators, meaning the product must exist on the U.S. market
- High-volume or multi-strength products, where dispensing flexibility matters most
- Meaningful U.S. enrollment (in my modeling, roughly 20% or more of the comparator demand) and a U.S. price within a reasonable band of the ex-U.S. alternative
And it has hard exclusions. Double-blind studies are the obvious one: a commercial pharmacy dispenses a commercially labeled product, which collides with the GMP blinding and labeling requirements of a blinded trial. Products not commercially available in the U.S., rescue medications that must be on-site immediately, and markets with restrictive regulatory frameworks all fall outside the model.
That said, double-blind studies are not automatically excluded. A third-party- or pharmacy-blinded comparator can still be sourced this way, where an unblinded sub-investigator issues the prescription and the site can wall the order off from blinded staff at both the operational and EMR level — certain Epic and Cerner builds support exactly this, though many do not. A study using pembrolizumab (Keytruda) to prepare a blinded infusion could be the consummate case: the pharmacist compounding the blinded preparation must be unblinded, while the blinded team must never see the order. Ultimately, this is a site capability assessment, not a sourcing decision.
The Economics: Why The Math Favors The Fifth Model
In part 1, I walked through a single high-cost oncology comparator sourced centrally from a lower-priced European market. Even starting from a lower unit price, the effective cost is driven not by acquisition price but by how much product you must buy to guarantee uninterrupted dosing — plus the full stack of traditional supply chain costs layered around it. Once I layered on a 30% overage buffer and replaced roughly 20% of inventory lost to expiry, the annual cost ballooned from $3.9 million to over $6 million; local U.S. site procurement solved the expiry problem but added the customary ~30% site markup, pushing the same comparator past $7.6 million. Let me make that abstract comparison concrete with a real comparator.
Ibrutinib (Imbruvica) is chosen here deliberately, as a stress test: it is expensive, oral, and unusually rich in presentations — capsules at 70 mg and 140 mg; tablets at 140 mg, 280 mg, 420 mg, and 560 mg; plus a 70 mg/mL oral suspension² — exactly the profile that produces unusually large differences in dispensing economics. That formulation ladder turns out to be the whole game. On price, the transatlantic gap is stark. In the U.S., AbbVie’s published list price is roughly $9,900 for a 28-day supply of the 420 mg tablet, while the average retail price for the 90-count 140 mg capsule bottle runs closer to $16,500.² A published Italian cost analysis, by contrast, lists the 140 mg unit at €67.40 ex-factory — on the order of $6,000 to $7,000 for an equivalent 90-count supply.³ Unit for unit, Europe wins by a factor of roughly two and a half.
So why would any sponsor source ibrutinib domestically? Consider an open-label oncology study enrolling 550 patients, half of whom (275) receive ibrutinib as the comparator at the standard 420 mg daily dose — one 90-count 140 mg bottle roughly every 28 days — over a multiyear treatment horizon until progression. The three sourcing paths compare like this, per patient, per cycle:
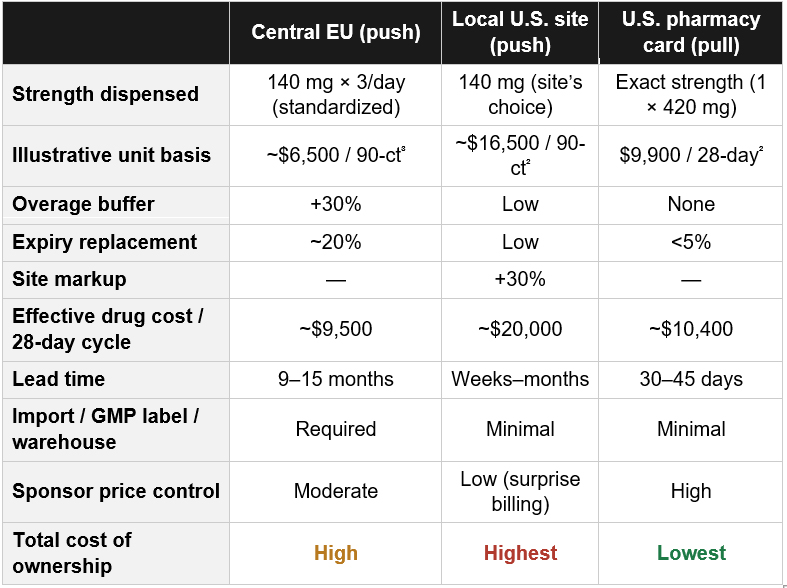
² GoodRx / AbbVie published U.S. list and retail pricing, 2026.³ Italian published cost analysis; ibrutinib 140 mg ex-factory unit €67.40. Figures are illustrative; actual procurement (WAC) pricing is confidential and varies by channel and country.
Scaled across that 275-patient cohort dosing for three years, the central EU path consumes on the order of $100 million-plus in ibrutinib alone once overage and expiry replacement are included — a sobering figure for a single comparator in a single study, and a useful answer to anyone who still treats comparator spend as a rounding error. Local U.S. sourcing roughly doubles that. The pharmacy card path lands close to the central EU figure on drug acquisition — which is remarkable, given that U.S. unit prices run two and a half times European ones.
How does the card model claw back a 2.5× unit price disadvantage? Through the formulation ladder. A patient on 420 mg/day can be dosed two ways — one 420 mg tablet or three 140 mg capsules — and because ibrutinib is priced per unit, the three-capsule route costs north of $15,000 per 28-day cycle while the single 420 mg tablet costs about $9,900.² The push model cannot capture that difference: a central depot either stocks all six presentations, multiplying overage and expiry exposure sixfold, or — as most teams do — standardizes on the 140 mg capsule and dispenses multiples. The card model dispenses the exact strength the clinician orders, on the day it is needed, defaulting full-dose patients to the cheaper 420 mg tablet and reserving 140 mg capsules for genuine dose reductions. That single lever, in this example, recovers much of the European price advantage.
The local-sourcing trap — a real example. Local site procurement deserves its own warning, because it quietly strips control from the sponsor. In my own experience, a site purchased the most expensive bottle configuration of a comparator — without sponsor approval — and then applied its customary 30% markup before billing us. We had no say in the SKU, no visibility into the price, and no recourse once the product was dispensed. Worse, those markups surface piecemeal — invoices arriving weeks or months after dispensing, across dozens of sites — turning reconciliation into a perpetual chase rather than the clean, near-real-time spend visibility a card model provides. Multiply that across a study and you get a stream of surprise invoices no forecast anticipated. The card model closes that door: dispensing strategy, strength logic, and price are all set at the program level, not improvised at each site’s pharmacy counter.
The table’s drug cost line actually understates the case, because it omits what only the push model carries: importation, GMP clinical labeling, GMP warehousing, depot handling, and the destruction of expired stock — plus the nine- to 15-month lead time and the supply continuity risk I described in part 1. Fold those in and the card model, which carries almost none of them, moves from “comparable on drug cost” to “lower on total cost” against central EU sourcing and to roughly half the cost of local U.S. procurement. The unit price, in other words, is a distraction; carried inventory, overhead, and lost control are where the money goes. And because you pay only for product dispensed, the model hands the sponsor something the push paradigm never does: direct control over drug spend and a predictable per-patient cost that tracks real enrollment rather than a forecast.
One honest caveat on the example itself. Ibrutinib’s pricing is a moving target — which is part of the point. As of January 1, 2026, it carries an Inflation Reduction Act–negotiated Medicare price well below its prior list,⁴ and a generic has received tentative FDA approval with a possible 2026 launch.² Either development narrows the transatlantic gap and pushes the card model’s drug acquisition cost from “comparable” toward “cheaper.” Far from undermining the case, this reinforces part 1’s central argument: comparator economics are dynamic, the published benchmarks are stale, and sponsors need to track how these products evolve — not only for commercial purchasing but for how they are consumed inside trials.

What It Takes To Adopt — And The Internal Hurdles Nobody Warns You About
Consistent with the practical bent of this series, here is what a supply team should actually work through before adopting the model — including the internal friction that tends to surface only after you’ve committed.
- Confirm the fit first. Run the open-label, U.S.-enrollment, commercial-availability, and multi-strength criteria above against the actual protocol. If the study is genuinely double-blind and the sites can’t maintain an EMR-level blind, stop here.
- Confirm the product can actually be sourced this way. Some manufacturers’ specialty pharmacy contracts contain clauses requiring notification — or outright restricting supply — when a product is dispensed for noncommercial use, which can constrain the card route for a specific drug. Worth being even-handed here: this is not a disadvantage unique to the pull model. Bulk and alternative market purchasing carry the mirror image risk, because unusually large or clearly noncommercial orders draw the same manufacturer scrutiny. As the rescinded comparator orders and the nine-month custom-batch delay in part 1 showed, going to a lower-cost market does not make that problem go away. Whichever channel you choose, verify the manufacturer’s and the specialty pharmacy’s terms early.
- Know the vendor landscape — because it’s thin. This is not a crowded market. At the time of my research, I identified only three vendors offering a true pharmacy card model: SupplyRx,⁵ a cloud-based platform that issues electronic prescription cards for mail order and specialty pharmacies, produced and deployed instantly; Myonex, through its CTRx prescription card service;⁶ and the RxStudy Card originating from TrialCard — now part of Valeris.⁷ If other smaller entities offer this model and are not on that short list, they are not well known, and they should make themselves visible — the field is small enough that a few additional credible providers would meaningfully change sponsors’ options.
- Settle the quality and audit question early. A pharmacy card vendor and the dispensing pharmacies behind it are already licensed and qualified facilities operating under state and federal pharmacy regulations. The open question is what a sponsor’s R&D quality unit is comfortable with: does that existing licensure satisfy your qualification requirements, or does your QA organization expect to audit the card vendor, the dispensing pharmacy, or both? There is no single right answer, but there is a wrong time to ask it — which is after the program is contracted. Get quality in the room during feasibility.
- Understand U.S. clinical labeling — it’s lighter than you think. This is one of the model’s quieter advantages. In the U.S., labeling a commercially dispensed comparator is minimal. The pharmacy already includes the directions for use (sig), lot number, expiry, and product name as a matter of course; the incremental research requirement is the FDA caution statement under 21 CFR 312.6.⁸ Beyond that, the pharmacy can align with the sponsor to add a subject number, study number, and sponsor name to the prescription label. That streamlined labeling is not a gap to apologize for but a structural advantage of the model: the absence of a separate clinical labeling and release campaign is precisely why the lead time collapses.
- Expect the regulatory standing question — and have the answer ready. A reasonable QA reviewer will ask whether dispensing a comparator through a commercial pharmacy changes its regulatory standing. It does not. FDA’s requirements under 21 CFR Part 312 attach to the comparator product — its labeling under §312.6 and its accountability and recordkeeping under §312.62 — not to the commercial arrangement by which it is acquired.⁸ A commercial pharmacy can satisfy them: it applies the §312.6 caution statement, records lot and expiry, and maintains the dispensing trail. The marketed drug’s approved status is unchanged by being filled this way, and the choice of comparator remains a scientific question governed by ICH E10, separate from how the product is sourced.⁹ What Part 312 simply does not regulate is the financing pathway — and a prescription card is precisely that: a financing and logistics mechanism, not a modification of the drug or the study.
- Plan for the IRT/RTSM interaction. I won’t dwell on systems here, but one point matters: a study running a pharmacy card model needs to be able to suppress the central resupply algorithm at the country or site level, so the system isn’t generating shipment triggers for product that the pharmacy network is dispensing on demand. More sophisticated modern IRT/RTSM platforms accommodate this; older ones may not. It’s a capability to confirm, not assume.
Looking Ahead
The pharmacy card model is often introduced as a sourcing efficiency — faster, leaner, less wasteful. It is all of those things. But its more interesting consequence is that it opens strategic capabilities the push model cannot touch: dispensing-level formulation flexibility, direct-to-patient distribution, and the ability for a sponsor to pay for standard-of-care and comparator drugs directly, transparently, and equitably at the point of dispensing — sidestepping the coverage denials, prior authorization delays, and unequal access that come with routing those costs through patients’ insurance. There is a more provocative version of this lever — deliberately shifting comparator or standard-of-care cost onto patients’ insurance — but it is far more fraught than it first appears, especially for government-insured patients, and that is where the model stops being an operational improvement and becomes a financial, legal, and ethical question. It is the subject of the fourth and final article in this series.
It is also where the ground has shifted since I did this research. The legal terrain around cost-sharing for government-insured patients has become harder, not easier, since 2022 — a development I’ll trace through to a January 2025 federal appeals court ruling that reshaped what is permissible.
One closing call to action, in the spirit of part 1. The waste reduction promise at the heart of this model — sub-5% versus the 30%–55% of the push paradigm — is, as of today, asserted by vendors and modeled by practitioners like me, but it is not validated in independent, published, controlled data.⁶ The most cited industry figure for comparator waste still traces to Tufts CSDD work shared at conferences, not to a peer-reviewed study of the pharmacy card alternative.¹⁰ If you run this model, measure what it actually saves, and publish it. The field cannot mature on vendor decks and a decade-old benchmark.
Acknowledgments. Special thanks to Toni Motomura and Brian Horan for their review and editorial input in shaping this series.
References
- Coppola G, Bilgin P, Pannatier S. 4 centralized comparator sourcing models to fortify supply chains. Clinical Supply Leader. July 15, 2025.
- Ibrutinib (Imbruvica) prescribing information and formulations, Pharmacyclics/AbbVie (DailyMed); U.S. list price ~$9,900 per 28-day 420 mg supply and ~$16,500 average retail per 90-ct 140 mg, per Murdock J, “How Much Is Imbruvica Without Insurance?” GoodRx Health, May 2026; generic ibrutinib tentative FDA approval, Targeted Oncology, 2025.
- Aiello A, D’Ausilio A, Lo Muto R, Randon F, Laurenti L. Cost-effectiveness analysis of ibrutinib in patients with Waldenström macroglobulinemia in Italy. J Mark Access Health Policy. 2017;5(1):1393308. doi:10.1080/20016689.2017.1393308
- Centers for Medicare & Medicaid Services. Inflation Reduction Act Medicare Drug Price Negotiation; ibrutinib negotiated price effective January 1, 2026.
- SupplyRx, Inc. Cloud-based pharmacy card platform for open-label clinical trial supply. https://www.supplyrx.com. Accessed June 2026.
- Myonex. CTRx Clinical Trial Patient Solutions — prescription-card sourcing and waste-reduction positioning. Accessed 2026.
- Valeris (formerly Mercalis; formerly TrialCard) — RxStudy Card clinical-trial prescription service.
- 21 CFR Part 312 — Investigational New Drug Application: §312.6 (labeling, including the FDA caution statement) and §312.62 (investigator recordkeeping and drug accountability).
- ICH Harmonised Tripartite Guideline E10: Choice of Control Group and Related Issues in Clinical Trials. International Council for Harmonisation; 2000 (FDA guidance, 2001).
- Tufts Center for the Study of Drug Development — comparator drug waste estimate (industry presentation, 2024); Lamberti MJ, Getz K, Walsh T, Pharm Exec, 2013 (original benchmark).
About The Author:
 John O’Brien is a clinical supply chain professional with experience managing comparator sourcing and distribution for global oncology clinical trials. His 2022 master’s capstone (CCP)project focused on re-engineering comparator supply through commercial pharmacy network integration and insurance cost-sharing, including collaboration with researchers at the Tufts Center for the Study of Drug Development, BeiGene (now BeOne Medicines), Myonex, TrialCard (now Veralis), and SupplyRx. This is the second article in a four-part series for Clinical Supply Leader.